The Peace Trade Has an Inventory Problem
- Henri Bardon
- 4 days ago
- 8 min read

I delayed Friday’s recap because the market was already trading the possibility of a Mideast agreement, and by Sunday we finally had confirmation of a political framework. Asia is now open, so today’s quotes reflect the first real trade after the agreement headlines rather than only Friday settlement. The first reaction was clear. Energy gave back a large part of the war premium. WTI July traded at $80.54, down $4.34, or 5.11%. Brent August traded at $87.33, down $3.05, or 3.37%. Heating oil July traded at $3.2742, down 3.82%. ICE gasoil July traded at $967.25, down $64.50, or 6.25%. On the surface, this looks like a major de-escalation trade. The problem is the structure does not look normal yet. Gasoil July/December remains backwardated at $96/mt, July/August is still $17.50/mt, and June/July since June expiry is now marked at +$72.25/mt. Flat price is down, but the product curve still tells us physical distillate remains tight.
This is the key difference between a political agreement and a physical normalization. The market is trading the idea of an agreement, but the document is not expected to be signed until Friday, June 19. That leaves too much time for things to go wrong. We do not need to debate the details of the MOU to understand the trading risk. Until the agreement is signed, implemented, and reflected in actual vessel movement through Hormuz, the market remains exposed to headline reversals. This is why the first Asia reaction looks more like removal of panic premium than a durable reset in physical energy balances.
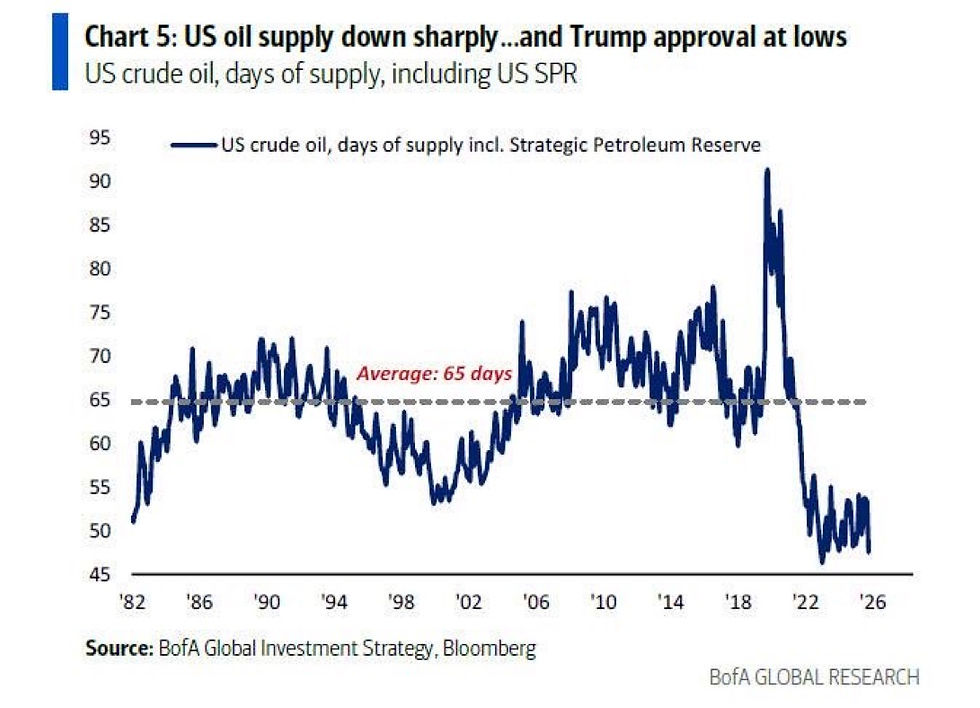
The inventory picture still matters more than the headline. U.S. crude oil days of supply, including the Strategic Petroleum Reserve, are now around 47 to 50 days, versus a long-term average near 65 days. That is close to the lowest level on the chart since the early 1980s. Cushing is the other issue the market should not ignore. Latest data put Cushing crude stocks near 21 million barrels, only slightly above the 20 million barrel area where tank-bottom and operating constraints start to matter. The market is therefore selling crude and gasoil into a political headline while the physical system still has limited spare inventory. That is not a clean bearish setup. It is a fragile relief trade. The weekly gasoil chart also argues against complacency. Gasoil has corrected hard from the spike above $1,500/mt, but it is still trading near $967/mt. More importantly, gasoil has broken its weighted moving-average structure and is now only around $10/mt above its 50-week moving average. That is a major technical change. The market has taken war premium out of gasoil quickly but the screen Heat crack margin is still at $57/brl. It has not done the same thing in soybean oil despite fact that soybean crush margins are also high.
India is also sending an important physical signal. The government capped retail diesel sales at 200 liters per customer or vehicle per day and barred commercial buyers from buying gasoline and diesel through retail stations. Diesel represents about 40% of India’s fuel demand, and bulk diesel is priced around 40 rupees per liter above retail levels. Private retail diesel sales fell 58% last month while state-run companies saw sales surge, with some areas up more than 30%. A net exporter of refined products does not impose those measures in a comfortable distillate market. This is physical stress caused by price controls, supply chain disruption, and refined product arbitrage.
The most important part of the Asia open is not the energy selloff, but the soybean oil stickiness. July soybean oil traded at 73.42 c/lb, down only 0.86 c/lb, or 1.16%, while gasoil lost 6.25% and heating oil lost 3.82%. In $/mt, July soybean oil is still $1,618/mt, down only $19.40. July/December soybean oil remains 4.52 c/lb backwardated, and July/August is still 1.40 c/lb. Bean oil as a percentage of gasoil jumped to 167.3%, up 5.40% on the day. BOGO moved to $652/mt, up $46.64, and BOHO moved to 2.22, up 2.57%. If this were only a diesel replacement trade, soybean oil should have followed gasoil lower more aggressively. It did not. Soybean oil is still clearly trading above its weighted moving averages, while gasoil has broken lower. That divergence tells me soybean oil is trading policy and feedstock scarcity, not only energy replacement value.
The 45Z update helps explain part of this. 45ZCF-GREET now separates 2025 production from 2026 production, and for 2026 fuels the model only includes feedstock from the U.S., Canada, and Mexico. That is a major change because it increases the value of North American feedstock versus offshore feedstock. ILUC is also removed for 2026 production. Biofuel producers have long viewed ILUC as an unjustified penalty, and removing it supports lower carbon intensity values for domestic pathways. CCUS treatment also helps certain ethanol, RNG, and Fischer-Tropsch pathways, but the more immediate trading point is simple: 45Z is reinforcing the domestic feedstock island at the same time D4 RINs are already at extreme levels! Expect higher RINs levels forward.
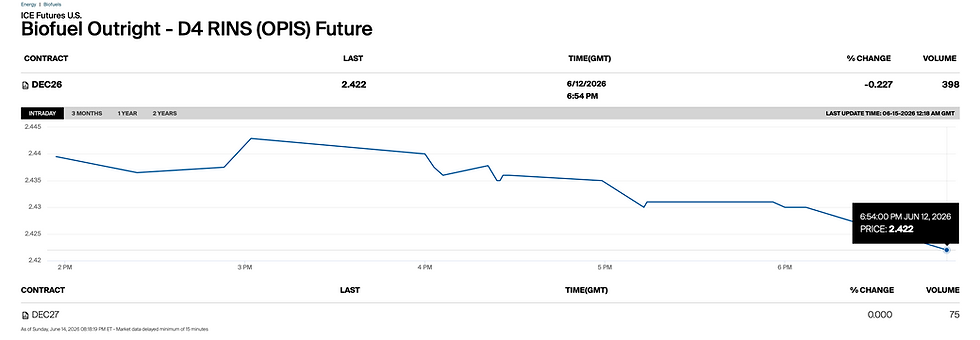
D4 RINs remain the other anchor. December 2026 D4 traded at 2.422, only slightly lower on the day and still at levels that keep biodiesel and RD economics alive even when soybean oil remains above diesel. D4 traded at $2.39 last week, the highest level in records going back to 2013. Biodiesel variable margins reached $1.77/gallon last week and averaged $1.63/gallon since March, compared with $0.48/gallon in 2025, $0.88/gallon in 2024, and $1.10/gallon in 2023. On my screen, the Asia-open RD crush for July fell to $0.317/gallon, down 14.87%, while conventional biodiesel crush fell to $0.809/gallon, down 7.35%. Even after the energy correction, conventional biodiesel still looks much better than RD because of the lower soybean oil conversion penalty and RIN support.
This is why soybean oil did not collapse with crude. The market is repricing Mideast risk in energy, but it is also repricing U.S. biofuel policy in vegetable oils. 2026 45Z favors North American feedstocks, D4 RINs remain above $2.40, ILUC is removed from the U.S. 45Z model for 2026 production, and the foreign feedstock issue keeps moving toward a structural premium for domestic oil.
At the same time, spec money is getting out of grains and oilseeds. That liquidation is not only about crop fundamentals. It is also about capital allocation. We are heading into another week of record equity issuance after the Friday SpaceX debut, and these large equity liquidity events are deflationary for commodities because they pull speculative capital away from futures markets. More importantly, that liquidity does not come back immediately. Once capital goes into new public shares, it is effectively locked for at least 60 days before those shares can be sold. This means commodities may face a difficult 60-day window where speculative capital remains scarce, macro funds reduce exposure, and futures markets become more dependent on physical and policy buyers. That makes soybean oil performance even more important. If managed money is liquidating grains and oilseeds while soybean oil still refuses to break below its weighted moving averages, then the bid is coming from policy and industrial demand rather than speculative length.

Palm oil is telling a different story. CPO was softer in the Asia open, with July around $1,116.50/mt, down $18, and Q3 around $1,125/mt, down $18.50. BOPO moved lower, with Q3 at $456.75/mt, down $33.58, while POGO widened sharply, with Q3 at $193.58, up $52.04. Malaysian stocks remain a headwind after May inventories rose 5% to 2.428 million mt, and early June stock estimates sit between 2.42 million and 2.57 million mt. Production for June 1-10 was also estimated 17.42% above the previous month. That leaves palm exposed when energy sells off. Indonesia also appears to be stepping back from direct export control. The new message is that commodity export prices will be monitored rather than handled through direct selling. That reduces the fear of a state middleman controlling palm exports, but it also confirms that Indonesia remains focused on under-invoicing, export pricing, and the rupiah. Palm is therefore under pressure from higher stocks and weaker energy, while soybean oil is supported by U.S. policy.
The global vegoil spread remains distorted. CFR West India CPO was indicated around $1,228 to $1,238/mt for July, while CFR West India soybean oil was around $1,265 to $1,275/mt for July and $1,233 to $1,243/mt for August. In Europe, FOB Rotterdam rapeseed oil was indicated around €1,290 to €1,300/mt offered for July, with bids around €1,245/mt, while Germany data shows soybean oil FOB Germany near €1,100/mt and rapeseed oil FOB Germany near €1,152/mt in June. The German chart also shows crude oil in New York falling from €719 to €592, while soybean oil only moved from €1,160 to €1,100 and rapeseed oil from €1,165 to €1,152. That is the same message as Chicago. Mineral oil fell, but vegetable oil did not reset lower in the same proportion.
Europe is having its own ILUC fight, and it matters for the soybean oil versus rapeseed oil spread. The core argument is that soybeans should not be treated the same way as rapeseed because soybean economics are still dominated by the 80% protein share, while rapeseed price formation is much more tied to vegetable oil markets. That distinction is important. If soybean oil receives a high-ILUC penalty in Europe, then soybean oil loses part of its biofuel outlet even when EU protein policy wants more local soybean production. Punishing soybean oil as a biofuel feedstock would work against Europe’s own protein strategy. This helps explain why traders should not only look at the outright price difference between soybean oil and rapeseed oil. The spread is also a policy spread. Rapeseed oil remains the preferred European biodiesel feedstock because of RED compliance and local supply logic, while soybean oil is caught between cheaper global availability, protein policy support, and a possible ILUC penalty. That creates a different type of stickiness than we see in the U.S., where 45Z now removes ILUC for 2026 production and supports North American feedstocks. In Europe, the same ILUC debate is still unresolved, and that uncertainty keeps soybean oil discounted versus rapeseed oil even when soybean oil is structurally supported in the U.S.

The European biodiesel window was active Friday. UCOME traded at $642 to $645/mt premium, FAME at $480 to $485/mt premium, RME at $565/mt premium, and HVO Class II at $1,380/mt premium. On flat price, the window marked FAME around $1,433/mt, UCOME around $1,594/mt, RME around $1,515/mt, and HVO Class II around $2,798/mt. June-to-date RME averaged $1,547.84/mt, FAME 0 averaged $1,472.54/mt, UCOME averaged $1,615.79/mt, and HVO Class II averaged $2,743.10/mt. The June-to-date average HVO and SAF flat prices sit at $2,820.02, $3,236.69, and $2,920.57 depending on class and product. The HVO premium remains large, but the correction in gasoil means any producer or blender relying on distillate replacement economics now needs mandate value, certificate value, or CI value to keep margins stable.
The European diesel balance also deserves attention. May European diesel imports fell to a 10-year low, down by a third from last year, with Middle East diesel imports close to zero. The replacement barrels have largely come from the United States, while European refineries increased local crude runs and drew down Western European crude stocks. That is not a comfortable setup for the fall heating season. There is no immediate diesel shortage in Europe today, but the system has less margin for error. If U.S. exports fail to cover European demand, or if Hormuz reopening proves slow, gasoil spreads should stay supported even if flat price has corrected.
The G7 meeting from June 15 to June 17 in Evian also adds near-term political risk. Border restrictions around Geneva and France have already started, and the timing matters because energy markets will trade both the Mideast agreement and any G7 comments on Iran, sanctions, maritime security, and oil logistics. A political framework is one step. A safe and trusted commercial shipping corridor is another. The market will need vessel movement, insurance normalization, and inventory stabilization before it fully removes the distillate risk premium.
The bottom line is that the peace trade is real, but the relief trade is fragile. Crude and gasoil are repricing lower in Asia, and gasoil has already broken its weighted moving-average structure while trading only around $10/mt above its 50-week moving average. Soybean oil is behaving differently. July bean oil only fell 1.16% while gasoil fell 6.25%, and soybean oil is still trading above its 20 day weighted moving averages despite speculative liquidation across grains and oilseeds. Spec capital is also being pulled into a heavy equity issuance calendar, and that liquidity may remain locked for at least 60 days. That creates a tough two-month window for commodities. The market is removing panic from energy, but it is not removing the RFS island effect from vegetable oils. Europe adds one more layer because soybean oil still faces unresolved ILUC risk there, while rapeseed oil retains stronger RED logic. The U.S. is removing ILUC from 45Z for 2026 production, while Europe is still debating whether soybean oil should be penalized. That policy split is now part of the soybean oil and rapeseed oil spread.


Comments