The MOU Sold Gasoil, Not the Physical Risk
- Henri Bardon
- 5 days ago
- 7 min read

The market had one clean reaction to the US-Iran interim agreement: sell flat energy first and ask questions later. July gasoil fell more than $100/mt on the day to roughly $926/mt, down 10.2%, with the weekly chart now breaking below the 50-week moving average area near $890/mt after trading above $1,000/mt last week. Brent and WTI moved in the same direction, with front Brent down more than $7/bbl toward $83/bbl and WTI down more than $4/bbl toward $80/bbl. On the screen, this looked like the market priced the reopening of the Strait of Hormuz and the end of the war-risk premium. The problem is that the rest of the complex did not validate such a clean normalization.

Soybean oil did not confirm the gasoil break. July soybean oil was basically unchanged near 74.25 c/lb, still above its 50-week moving average near 72.00 c/lb, far above its 100-week moving average near 62.75 c/lb and still more than 10% higher over three months. July/December soybean oil widened to around 5.15 c/lb, up more than 0.50 c/lb on the day, while July/September widened to around 3.20 c/lb. If traders were truly pricing a return to pre-war energy and freight conditions, soybean oil should have joined the liquidation. Instead, gasoil collapsed while bean oil stayed sticky, pushing July BOGO to roughly +$710/mt, up more than $100/mt on the day, and keeping BOPO near +$520/mt. This remains the RFS island effect in full display. US soybean oil is not trading like a normal global soft oil. It is trading like a constrained compliance feedstock inside a distorted mandate structure.
The distillate signal is also more complicated than the flat price move. Heating oil weakened, with July down around 3.7% near $3.28/gal, but the weekly heat crack remains near $56.80/bbl. That is still historically elevated versus most of 2024 and early 2025. Heating oil spreads also remain firm, with Jun/Sep near +0.3294/gal and Jun/Dec near +0.4539/gal. Northwest European gasoline cracks also moved higher, with the EBOB crack rising to $30.70/bbl from $26.44/bbl while crude fell. That is not a clean demand destruction signal. It looks more like a violent political repricing in crude and gasoil while refined product margins remain tight enough to warn that physical markets have not relaxed yet.

The key issue is timing. The market is trading the agreement as if Hormuz already reopened, but the vessel data still says otherwise. Before the closure, commercial crossings through Hormuz were running around 100 to 130 vessels per rolling 24 hours, with tanker crossings often around 50 to 70. The latest readings are still basically frozen, with one chart showing total commercial crossings near 1 and another showing around 4 tankers plus 1 dry cargo ship. Until the crossing count moves from 1 to 5 back toward 100 to 130 per day, the market is trading a promise, not a physical normalization. The first move was the headline. The second move will come from vessel counts.

My view is that this Administration mainly wants the war to stop and the Strait of Hormuz to return exactly to its pre-war condition. Everything else looks secondary. Sanctions relief, frozen funds, the nuclear file, Lebanon, regional architecture and security guarantees all sound important, but in practical market terms they are decoration unless they block the reopening of Hormuz. Once Iran lets flows move again, Washington has less incentive to spend political capital on the deeper package. That is where the real risk sits. If Iran concludes that the Administration used the MOU to stop the war and restore shipping while leaving the real sanctions and nuclear issues unresolved, Iran’s reaction will dictate the next market move.
That reaction does not need to be a full return to war. Slower mine clearance, selective inspections, new Iran-Oman traffic administration, insurance ambiguity, vessel spacing, fees, delays or pressure through Lebanon would be enough to keep energy volatility high. The agreement creates a 60-day negotiation window after a prior two-week ceasefire already turned into roughly two months of talks. That is not a volatility suppressant. It is a volatility schedule. The market must price every comment, every vessel count, every sanctions headline, every Israeli response and every sign of Iranian frustration. My sense is that it will take about one week for traders to realize that the real trade is not the end of the crisis. The real trade is 60 days of extreme volatility.
Weakness in gasoil is never good for biodiesel and renewable diesel. Lower gasoil immediately reduces the fossil replacement value and compresses the energy leg of the margin. The reason today’s move did not break the biofuel complex is that D4 RINs remain very firm, with Dec26 near 2.44, up slightly on the day. That is an extraordinary compliance value to carry while gasoil loses more than $100/mt. US biodiesel screen crush weakened but did not collapse, with the July RD screen near 0.28 c/gal and the July conventional biodiesel screen near 0.78 c/gal. Those values are lower on the day, but they still show that RINs and soybean oil carry the economics even as gasoil gives back war premium. If EPA, refiners or obligated parties believed immediate energy relief would solve the compliance problem, D4 RINs should have backed off more. They did not.
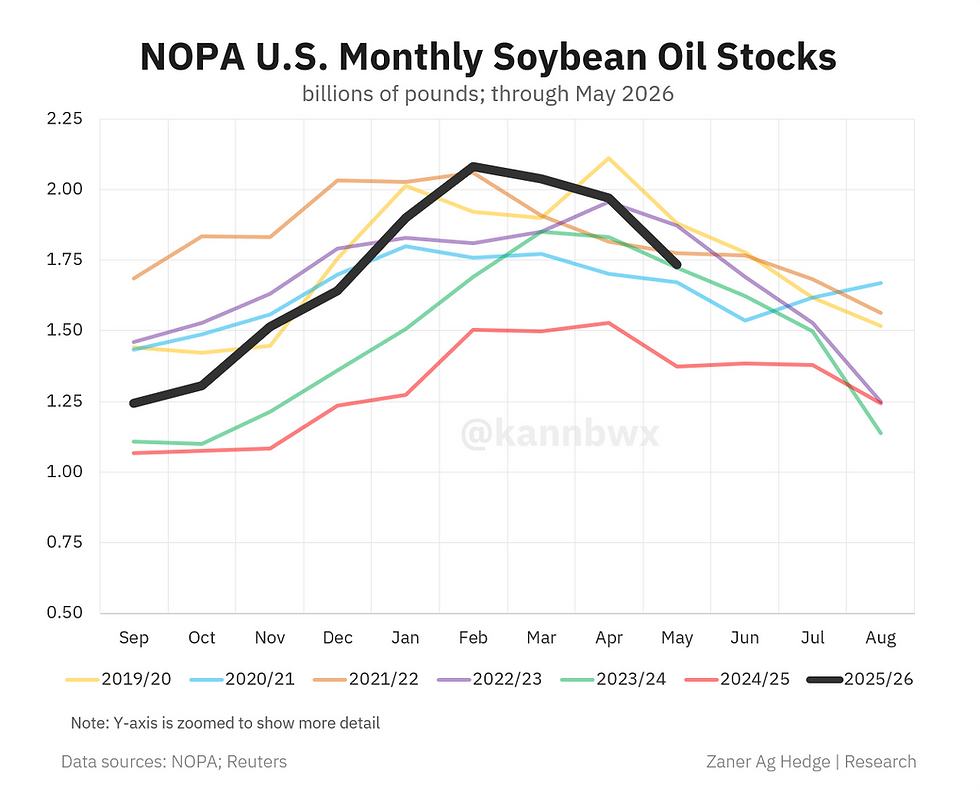
The NOPA data also supports soybean oil. May crush came in at 208.785 million bushels, below the 211.86 million bushel average estimate, but still 8% above May last year. Soybean oil stocks were 1.735 billion pounds, below every analyst estimate and well below the 1.855 billion pound average estimate. Stocks are still up 26% year on year, but the year-on-year margin is now the smallest in seven months. A market with below-expectation oil stocks, D4 RINs near 2.44 and July soybean oil above 74 c/lb is not set up for a simple collapse because gasoil had one violent down day.
Europe also refused to trade like the biofuel market broke. In the ARA window, UCOME traded 670 and 685, HVO Class II traded 1,430 to 1,435, FAME traded 525 to 530 and RME traded 585. Paper volumes were also healthy, with FAME trading 42.5 kt, UCOME 44 kt, RME 37.6 kt and HVO Class II 20 kt. The latest marks put RME Q3 around 1,451 to 1,471, FAME 0 Q3 around 1,396 to 1,416, UCOME Q3 around 1,531 to 1,551 and HVO Q3 around 2,716 to 2,736. That is not a collapse in mandate value. It shows that RED qualification, GHG value and limited physical flexibility still matter even after the gasoil leg sold off.
The broader June biofuel prints confirm the same point. FAME RED was last around 1,449 on June 12, with a month-to-date average near 1,462. RME RED was around 1,531, with a month-to-date average near 1,550. UCOME was around 1,610, with a month-to-date average near 1,617. HVO Class 2 was around 2,816, with a month-to-date average near 2,847. Gasoil had already fallen to around 967 on June 12 from earlier June levels above 1,090, yet biofuel premiums did not disappear. That is the key message from Europe. The gasoil leg is volatile, but the mandate leg is still sticky.
Palm oil is a different story, but it is not a bearish policy shock. Malaysia set the July palm oil reference price at MYR 4,346.79/mt, down from MYR 4,372.64/mt in June, while keeping the export tax at 10%. That puts the effective July export duty near MYR 434.679/mt, or about $107.46/mt using a USDMYR reference rate of 4.045. Palm remains cheaper than US soybean oil, but it does not solve the US RFS distortion. July BOPO near +$520/mt and September BOPO near +$434/mt still show that US soybean oil trades far above palm because US compliance demand is not freely connected to the global vegetable oil balance.
There is also a broader input-cost signal outside energy. Sulfur has moved into a broken-market configuration, with spot indications around $1,200 to $1,265/mt versus a more normal long-term level below $200/mt. That matters for fertilizers, mining, pulp, paper and industrial chains. If Hormuz logistics remain constrained, sulfur is another reminder that the physical economy does not normalize with one political announcement. Supply chains reopen through vessels, ports, insurers and cargoes. They do not reopen through headlines.

The grain and oilseed liquidation also needs context. Soy funds were still long around 97,000 contracts after being long 155,000 the prior week. Soybean oil funds were still long around 128,000 contracts versus 150,000 the prior week. Meal funds were still long around 55,000 contracts versus 127,000 the prior week. Corn saw much more aggressive liquidation, moving from around 293,000 contracts long three weeks ago to roughly 15,000 contracts short now. This means the liquidation pressure is real, but soybean oil has resisted better than corn and meal because it still has RINs, low oil stocks and mandate economics behind it.
Macro is adding pressure rather than comfort. Speculators have lifted long-dollar exposure to roughly $27.8 billion, the largest bullish dollar bet since early 2025. Gold rallied around 2.75% on the day even as crude and gasoil sold off. That is not a clean risk-on signal. It is a sign of stress, hedging and positioning. Commodities are also facing a liquidity drain as capital shifts toward large equity and high-tech issuance events. When capital enters those events, it is often locked for at least 60 days before public shares become freely saleable. That makes the next 60 days more difficult for grains, oilseeds and biofuel traders because geopolitical volatility is now meeting capital-market liquidity extraction.

The conclusion for today is simple in a complex situation. The market sold gasoil because it saw the word deal. Soybean oil, D4 RINs, heat cracks, European biodiesel premiums, sulfur and Hormuz vessel counts are telling us the physical market still needs proof. We need ships through Hormuz, not signatures. We need crossings back toward 100 to 130 per day, not 1 to 5. Until that happens, the $100/mt break in gasoil is a headline repricing, not a confirmed return to normal. The next week should teach the market that the MOU did not remove volatility. It placed a 60-day clock around it which is coincidentally the same time constraints for IPO shares lock-up.


Comments