No Resolution on Supply Flows as Back-End Gasoil Spreads Extend the Distillate Deficit and Support Biofuels
- Henri Bardon
- 1 day ago
- 4 min read

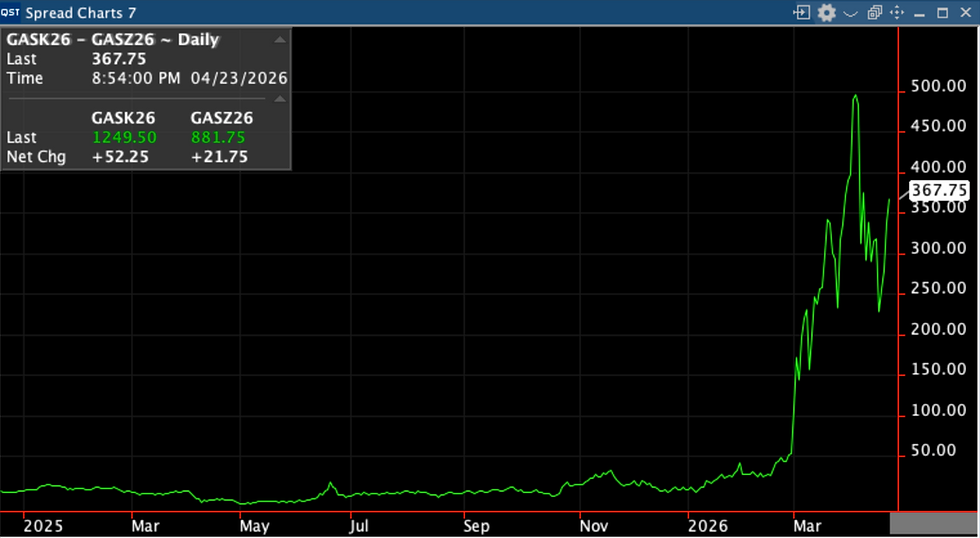
Distillate structure continues to tighten with a clear shift toward the back of the curve. ICE gasoil May/Dec is holding around +370/mt, while Jul/Dec strengthened further and is now leading the curve at +210. The relative move in Jul–Dec versus May–Dec confirms that the market is extending the duration of the deficit into summer and Q4. This comes as negotiations around the Strait remain unresolved, with probabilities shifting toward disruption persisting into June rather than resolving in May.

This structure aligns with refinery data. Asia runs have declined from roughly 32–33 mbpd earlier in the year to around 28–29 mbpd, a reduction of about 3 mbpd. At the same time, substitution away from Middle East crude reduces distillate yield from about 60% to closer to 40% on displaced barrels. This implies a loss of roughly 0.2 barrels of distillate per barrel displaced, reinforcing the structural shortage. This means the world is structurally short diesel and jet fuel.

Within the barrel, jet fuel remains the strongest component and continues to underpin the complex. Singapore jet is trading near $187.5/bbl versus diesel around $176/bbl, a premium of roughly $10–12/bbl. In Europe, NWE jet CIF cargoes at ~$1,555/mt still trade about $280/mt above gasoil near ~$1,270/mt. This premium supports refinery optimization toward jet and anchors SAF economics.
Northwest Europe biodiesel markets continue to price at premiums over ICE gasoil. Window activity shows FAME 0 at +$70–90/mt over ICE, implying $1,340–1,360/mt flat price. RME traded at +$110–130/mt, implying $1,380–1,400/mt. UCOME remains highest at +$280–320/mt, implying $1,550–1,600/mt.
The UCOME–RME spread remains around $150–200/mt despite a ~30 percentage point GHG advantage, indicating that still compliance demand remains the dominant pricing driver.
Gasoil backwardation at +370/mt discourages storage and forces continuous prompt buying. This supports physical premiums because buyers cannot defer purchases economically.
Renewable diesel continues to track distillates. HVO Class I traded in AOM at about +$1,200/m³ over ICE gasoil, equivalent to roughly +$1,020–1,050/mt. With ICE gasoil near $1,270/mt, this implies HVO flat price around $2,300–2,350/mt, or roughly $700–800/mt above UCOME.
SAF remains the highest value product. NWE SAF FOB barges traded near $3,046/mt, up about $240/mt on the day, while China SAF traded near $2,919/mt. SAF trades at a premium of roughly $600–700/mt over HVO and about $1,400–1,500/mt over jet. Jet strength provides the floor, but feedstock scarcity is driving the premium.
Feedstock pricing shows a different structure than earlier suggested. Global vegoil markets are in backwardation. Front-month soyoil spreads are inverted, and physical markets are tight. However, there is a clear geographic dislocation. Soyoil outside the United States trades significantly cheaper, with FOB Paranaguá discounts in the range of -1,500 to -1,700 points versus CBOT. This equates to only oughly $30 to $35/mt discount to US-linked pricing but destination soyoil swaps are indicating that FOB paranagua should be considerably cheaper.
This creates the “US RFS island” effect. Domestic US prices are supported by RFS and expected RVO demand, while global markets remain relatively cheaper despite backwardation. The result is a strong incentive for flows of US-origin beans into global crush and potential re-import of oil, or direct imports of cheaper soyoil for non-fuel use. Soyoil CFR India July Swaps are around $1282/mt while CBOT futures are $1580/mt... that is a theoretical $300/mt discount.
UCO CIF US Gulf Coast is around $1,220–1,230/mt, down about $20/mt on the day, while tallow is around $1,100–1,110/mt. The spread between SAF at ~$3,000/mt and UCO at ~$1,220/mt implies a gross transformation spread of ~$1,700–1,800/mt before processing costs.
A new demand layer is emerging in Asia that could tighten this further. Some shipping players are blending UCOME into marine fuel to reduce lifecycle emissions and capture those reductions at the point of combustion. There are also early attempts to monetize those reductions externally by reselling scope 3. Unlike aviation under CORSIA, where double counting is prohibited, shipping does not yet have a fully defined framework. If such structures are allowed, UCOME demand would increase beyond physical blending volumes.
European rapeseed supply provides limited relief. EU rapeseed area is expected to increase by about 2.7% to 6.3 million hectares, but production is projected at 20.4 million tonnes versus 20.5 million tonnes last year. This implies flat output despite higher acreage and confirms that Europe is not adding meaningful new feedstock supply.

In the United States, ULSD is trading around $3.80/gal, or roughly $1,270–1,300/mt. The arbitrage into Europe remains closed, limiting balancing flows. B100 Gulf Coast at $6.35–6.40/gal implies roughly $2,100–2,150/mt, or an $800–850/mt premium over ULSD.
The key signal today is the combination of three factors. First, back-end gasoil spreads are strengthening, with Jul–Dec leading May–Dec, indicating a prolonged distillate deficit. Second, jet remains the strongest component of the barrel, supporting both diesel and SAF economics. Third, vegoil markets are backwardated globally but remain significantly cheaper outside the US, reinforcing the US island effect.
As long as gasoil backwardation holds above +300/mt and SAF maintains a $600–700/mt premium over HVO, the system will continue to pull on feedstocks. The addition of potential new demand from shipping only increases the risk that waste-based feedstocks tighten further into the second half of the year.


Comments