War Premium Meets IPO Liquidity Drain
- Henri Bardon
- 3 minutes ago
- 6 min read

The energy market remains trapped between two opposing signals. The physical signal is still bullish. Hormuz remains effectively closed, June gasoil expired at a $21.25/mt premium to July, and D4 RINs remain near 2.43. The financial signal is less supportive. WTI July settled near $87.92, down $2.11 on the day, while Brent July settled near $90.69, down $2.41. That is the daily contradiction. The physical market is not normal, but flat price still keeps fading each war headline.
Gasoil gives the cleaner read than crude. June gasoil expired at +$21.25/mt over July after trading almost flat in late May and above +$120/mt in late March. Front gasoil settled near $1,035.25/mt, July near $1,014/mt, August near $997.25/mt and September near $979.75/mt. The flat price was lower on the day, but the front spread tightened into expiry. A weakening flat price with a stronger front spread is not a clean bearish signal. It shows liquidity pressure on the screen while nearby distillate still carries stress. Screen Heat Crack Margin remains strong at near $60/Brl!!

My concern is that this Mideast volatility continues through early July. The market is not resolving anything day to day. We are trading strike headlines, ceasefire headlines, China run cuts, Saudi allocation numbers, Hormuz crossing data and gasoil curve stress in the same session. That is why the market feels like a yoyo. The bearish number is China’s July Saudi allocation near 12 million barrels, or about 387,000 bpd, which is less than one-third of China’s 2025 average Saudi crude intake. The bullish number is the June gasoil expiry at +$21.25/mt and the continued closure of Hormuz. Both are true at the same time.
There is also a liquidity issue. Tomorrow’s SPCX IPO is reported as a $75 billion equity raise at $135/share, with valuation near $1.75 trillion and demand approaching 4X oversubscribed. That is a major capital absorption event. We also have more large high-tech IPOs coming next week. I do not have the deal sizes for those yet, but the direction is clear enough for a trading observation: capital is being pulled toward equity growth issuance at the same time commodities are trying to price war risk. In my view, that is deflationary for commodities at the margin because some risk capital is being redirected away from commodity length, inventory financing and inflation hedges.
For biodiesel and RD traders, this matters because a red energy screen today does not necessarily mean the distillate balance has weakened. The screen can weaken because capital is being reallocated. The physical data still points to stress: gasoil expired at +$21.25/mt, D4 RINs remain around 2.43, July soybean oil remains above $1,640/mt, and European UCOME remains above $1,600/mt. The market is not resolving Mideast risk. It is repricing liquidity around Mideast risk.
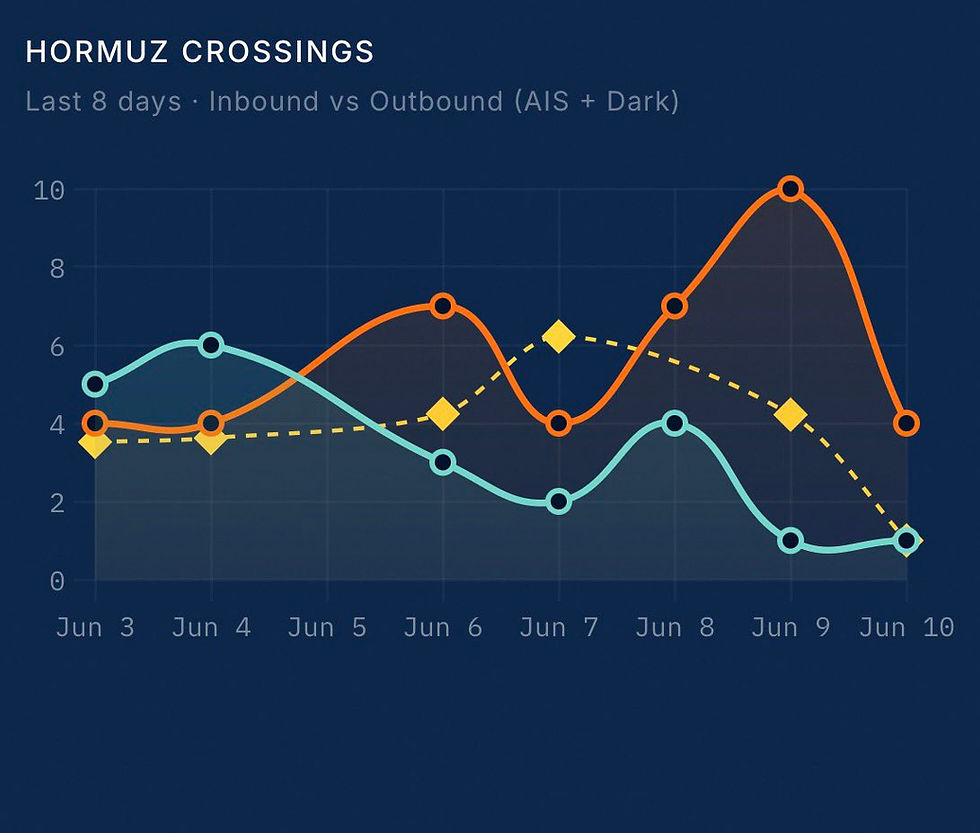
The Hormuz crossing data also remains important. The latest traffic pattern still shows more emphasis on vessels trying to exit the region than vessels entering it. Inbound crossings faded sharply into June 9 and June 10, while outbound flows remained more active. That is not normal logistics. It suggests owners, charterers and refiners are still reducing exposure to the Gulf. This is one reason I do not want to read lower crude as proof that the war premium has disappeared.
China remains the largest demand offset. Saudi July crude supply to China is expected near 12 million barrels, or about 387,000 bpd. Sinopec reportedly did not buy Saudi crude for a second consecutive month. Aramco cut July official selling prices to Asia by $6/bbl from June, but those prices are still above pre-war levels. Chinese refiners are cutting runs because high crude prices and weak fuel demand have pushed margins into losses. That is why crude is not above $100 even with Hormuz effectively closed. Weak Chinese demand is absorbing part of the supply shock.
Refined products remain more relevant than crude for biodiesel. NWE gasoline margins rose to $24.95/bbl even though ARA gasoline stocks increased by more than 10% to 1.14 million mt. Russian seaborne oil product exports slipped only 0.2% month-on-month in May to 8.016 million mt, but the regional split shows stress. Baltic loadings rose 11.3% to 3.82 million mt, while Black Sea and Azov Sea loadings fell 19.7% to 3.03 million mt after repeated drone strikes. Product supply is not collapsing, but it is being rerouted and redistributed under stress. EU is issuing now a 21st Sanctions package that will add secondary sanctions.
Soybean oil remains the key US biodiesel signal. July soybean oil closed near 74.45 c/lb, down 0.88 c/lb, while December closed near 70.14 c/lb. The July/December spread eased to 4.31 c/lb, but it remains a large backwardation. July soybean oil is still around $1,641/mt, and December is still around $1,546/mt. July soybean oil is now near 162% of July gasoil, while December soybean oil is near 170% of December gasoil. That ratio tells us soybean oil is not following crude lower in a straight line. RINs, RVO demand and the RFS island effect remain the stronger drivers.
D4 RINs remain the fire alarm. December 2026 D4 RINs traded around 2.430, and December 2027 around 2.470. At those values, RINs still support soybean oil and conventional biodiesel margins. The July RD soybean oil crush is near $0.5105/gal, while the July conventional biodiesel soybean oil crush is near $1.0111/gal. That spread matters. Conventional biodiesel remains in a better screen position than RD because the RIN and product yield math are more favorable.

Palm oil was steadier than soybean oil. USD CPO was near $1,144.50/mt for May, with July around $1,129.75/mt and December near $1,159.25/mt. BOPO for July remains near $511/mt, and September near $439/mt. That is still a large soybean oil premium over palm oil. This is why the US soybean oil market remains dangerous to read as a global vegetable oil signal. The US has RINs. The global market has palm oil, rapeseed oil, UCO and more price-sensitive demand.
Indonesia reduced one palm oil risk, but it did not remove policy risk. The government appears to be stepping back from a plan to centralize strategic commodity exports through a state-linked entity and moving toward tighter export price monitoring instead. That is less disruptive than a single-exporter model. It still means palm exporters and buyers need to watch pricing methodology, under-invoicing reviews and enforcement. Palm oil avoided the bigger export bottleneck risk for now, but Indonesia still wants tighter control over value capture.
Europe’s biodiesel window was active and firm. RME traded at a $495/mt premium, with flat price near $1,525/mt. FAME 0 traded around $425 to $430/mt premium, averaging near $428/mt and a flat price near $1,459/mt. UCOME traded at $560, $585 and $599/mt premiums, averaging near $581/mt and a flat price near $1,612/mt. HVO Class II traded at a $1,370/m3 premium, with flat price near $2,873/mt. Month-to-date averages remain high: RME near $1,551/mt, FAME 0 near $1,477/mt, UCOME near $1,618/mt and HVO Class II premium near $1,320/m3.
The European margin structure is still mixed but not weak. Spot RME versus rapeseed oil is around $76/mt, and RME versus FAME 0 is also around $76/mt. UCOME versus UCO remains stronger. UCO ex-works Netherlands is around €1,135/mt, UCO cif ARA is around $1,195/mt, and UCOME is near $1,612 to $1,618/mt. That is why UCOME stays bid despite weaker gasoil days. High GHG savings >89% and mandate compliance still matter more than one daily move in crude.
EcoCeres adds another SAF and RD supply issue. The Johor biorefinery in Malaysia, with about 420,000 mt/year of SAF and renewable diesel capacity, remains shut after an environmental compliance order related to its effluent treatment system. Suppliers have been asked to defer or cancel POME deliveries, and the outage could extend into September. EcoCeres still operates its Zhangjiagang plant in China, with about 350,000 mt/year of SAF and renewable diesel capacity. The Johor shutdown matters because it removes a major Southeast Asian waste-feedstock production point while Europe is scaling SAF demand. It also puts POME traceability back under scrutiny.
The USDA report did not change the soybean oil story. Old-crop soybean crush was raised by 20 million bushels, while exports were lowered by 20 million bushels, leaving stocks unchanged. New-crop soybean carryout sits near 310 million bushels, with crush projected near 2.75 billion bushels. World soybean carryout is near 124.88 million mt. This was not a bearish demand reset or a bullish acreage shock. The June 30 acreage report matters more. For now, soybean oil remains driven more by RVO, RINs, energy security and low-CI feedstock scarcity than by the June USDA balance sheet.
The trading conclusion is that the market is not short of geopolitical risk. It is short of liquidity. Hormuz remains effectively closed. China is capping crude through weaker imports and lower refinery runs. Gasoil still shows nearby stress after expiring at +$21.25/mt over July. D4 RINs remain around 2.43. July soybean oil remains above $1,640/mt. European UCOME remains above $1,600/mt. The market keeps trying to fade the war on every peace headline, but the product and biofuel numbers are not confirming a clean resolution. For biodiesel and RD traders, headline risk stays two-sided, while the structural support from distillate security, RINs and mandate demand remains intact.


Comments