US Refiners Push Back EPA In Court as High Cracks Meet High RINs
- Henri Bardon
- 3 days ago
- 6 min read

The screen tried to sell peace today, but the biofuel market did not confirm a clean bearish turn. WTI July fell $3.71/bbl to $92.31, Brent August fell $2.62/bbl to $95.19, ICE gasoil June fell $49.75/mt to $1,074/mt, and heating oil July fell 18.30 cents to $3.6651/gal. That was a large energy correction, driven by ceasefire headlines and hope of wider de-escalation in the Middle East. The problem for biodiesel traders is that the structure underneath the move still looks tight. ICE gasoil June/December remained at $152.50/mt, July/December at $136.50/mt, and Jun/September at $75/mt. In Asia, Singapore 10 ppm gasoil closed at $149.30/bbl, down $3.73/bbl, but the cash differential was still $5.46/bbl and the refining margin closed near $49/bbl. Singapore middle distillate stocks declined for a third straight week to nearly a three-month low. That is not a comfortable inventory backdrop for a market trying to remove war premium.
The refining backdrop makes the RIN move even more politically sensitive. Screen heat crack was still $61.04/bbl today, while the 3:2:1 crack was $43.22/bbl, both basis WTI. Brent was also trading roughly $5/bbl over WTI, which means Atlantic Basin refining margins remain even more attractive when expressed against WTI-linked crude. These are historically high petroleum margins even after today’s energy sell-off. That is why AFPM’s lawsuit against EPA biofuel blending mandates is exactly what we should expect. Refiners are seeing strong economics from maximizing diesel and gasoline production, while RFS compliance has become expensive because D4 RINs are near $2.43 and mandated blending cuts into the objective of maximizing margin production. The lawsuit is not just a policy headline. It reflects the collision between high petroleum cracks, high RIN values, and the operational cost of compliance.

The trading implication is that the lawsuit is unlikely to kill the RFS, but it increases the odds that EPA softens the implementation path. At D4 RINs near $2.50, the RIN liability for independent refiners is becoming too large to ignore, especially when screen heat crack is still $61.04/bbl and the 3:2:1 crack is still $43.22/bbl. EPA does not need to abandon the RFS to relieve pressure. It has several possible release valves: more flexibility on imported feedstock, more flexibility on imported biodiesel and renewable diesel from qualified plants, a longer compliance period, or some use of RFS waiver authority if EPA concludes that implementation creates severe economic harm or inadequate domestic supply. With Lee Zeldin leading EPA, and with the current administration generally more skeptical of aggressive environmental mandates, I would not be surprised if EPA looks for flexibility rather than forcing independent refiners to carry an unsustainable RIN liability. For traders, that would be bearish D4 RINs, bearish U.S. soybean oil premiums, and bearish domestic biodiesel margins, while supportive to imported biodiesel, renewable diesel and qualified low-CI feedstock.
The more important point is that RINs are no longer trading like a secondary credit. They are the pricing engine for soybean oil and biodiesel. December 2026 D4 RINs were quoted at $2.430, up 0.872%, and December 2027 D4 RINs were at $2.486. At the same time, the soybean oil and diesel relationship remains distorted. July soybean oil fell 2.30 cents to 76.41 cents/lb, equal to $1,684.53/mt, while July bean oil as a percentage of gasoil rose to 159.18%. In other words, soybean oil fell on the screen but became more expensive relative to diesel because gasoil fell harder. That is the core distortion. BOGO July only slipped $2.46/mt to $626.53/mt, while September was $636.81/mt and December was $673.53/mt. The market is saying the RFS island effect remains intact even as crude and products correct.
Margins tell the same story. The conventional biodiesel crush for July was still close to $0.99/gal, September was $1.0513/gal, and December was $0.9952/gal. The renewable diesel crush was weaker in absolute terms but still positive, with July at $0.4669/gal, September at $0.5523/gal, and December at $0.5147/gal. That means the U.S. system is still paying for feedstock even with July soybean oil down almost 3% on the day. The crusher signal is also strong. Soybean crush margins were lower on the day, with July down 17.6 cents to 399.6 cents, but they remain elevated against the same period three months ago, up 93.85%. Fund liquidation in soybeans and good Midwest weather are pressuring the grain side, yet the oil share remains protected by D4 RINs, 45Z expectations, and the absence of enough imported feedstock to calm the market.

The international vegetable oil market still does not look bearish enough to break the U.S. move. Palm corrected today, with the August BMD equivalent around $1,178.75/mt on the screen, but CPO had just rallied 3.09% on June 3 to 4,675 ringgit per tonne after the two-day break. Malaysia export data remains weak, with May exports reported down 15.45% month on month and inventories expected near 2.36 million tonnes, up 2.2% from April. China’s three main vegetable oil stocks were stable at 2.01 million tonnes as of May 29, with soybean oil at 880,000 tonnes, palm oil at 770,000 tonnes, and rapeseed oil at 340,000 tonnes. That is not a shortage signal, but rapeseed oil remains firm on supply concerns, with Zhengzhou September rapeseed oil above 10,000 yuan per tonne and up 3.94% in the last reported session. European soft oils also remain expensive. Dutch-origin soybean oil was offered at €1,130/mt FOB for June and July, German-origin soybean oil was €1,165/mt for June, and Dutch rapeseed oil was still €1,370/mt for June. Sunflower oil was quoted at $1,520/mt FOB North European ports for July/September, up $20/mt.
Brazil remains the obvious pressure valve, but the arbitrage is still political and logistical before it is purely mathematical. Paranaguá soybean oil was quoted around 2,400 points under Chicago for July and around 2,200 points under for August/September. That is a massive discount to U.S. soybean oil, and it keeps the argument alive that the U.S. soybean oil premium must either collapse or attract imported molecules through biodiesel, renewable diesel, or feedstock channels. The new tariff discussion cuts in the opposite direction. Proposed U.S. duties, including 25% on selected Brazilian goods and 12.5% on several other origins, would raise the cost of competing imports if implemented and would support domestic feedstock values. That is why the market is stuck. Brazil is cheap, RINs are expensive, U.S. policy is unstable, and the physical system has not yet delivered enough foreign feedstock to force convergence.
Europe was active again. In the ARA window, RME traded at $505/mt premium, FAME traded several times between $380/mt and $445/mt, and UCOME traded mostly around $539/mt to $540/mt. The window report showed month-to-date average flat prices at $1,571.91/mt for RME, $1,505.80/mt for FAME 0, and $1,644.93/mt for UCOME. TFS marked FOB ARA flat prices at $1,528/mt for June RME, $1,463/mt for June FAME 0, $1,588/mt for June UCOME, and $2,833/mt for June HVO. July was $1,482/mt for RME, $1,422/mt for FAME 0, $1,552/mt for UCOME, and $2,812/mt for HVO. Those prices are not collapsing. ARA biodiesel premiums softened versus yesterday in some parts of the curve, but physical trading remained broad enough to show real demand and real coverage interest. Paper activity also showed RME July at $450/mt premium, FAME June at $400/mt, UCOME July at $520/mt, and HVO II Q4/Q1 trading at $72 to $75/mt. The market is not acting like buyers have disappeared.
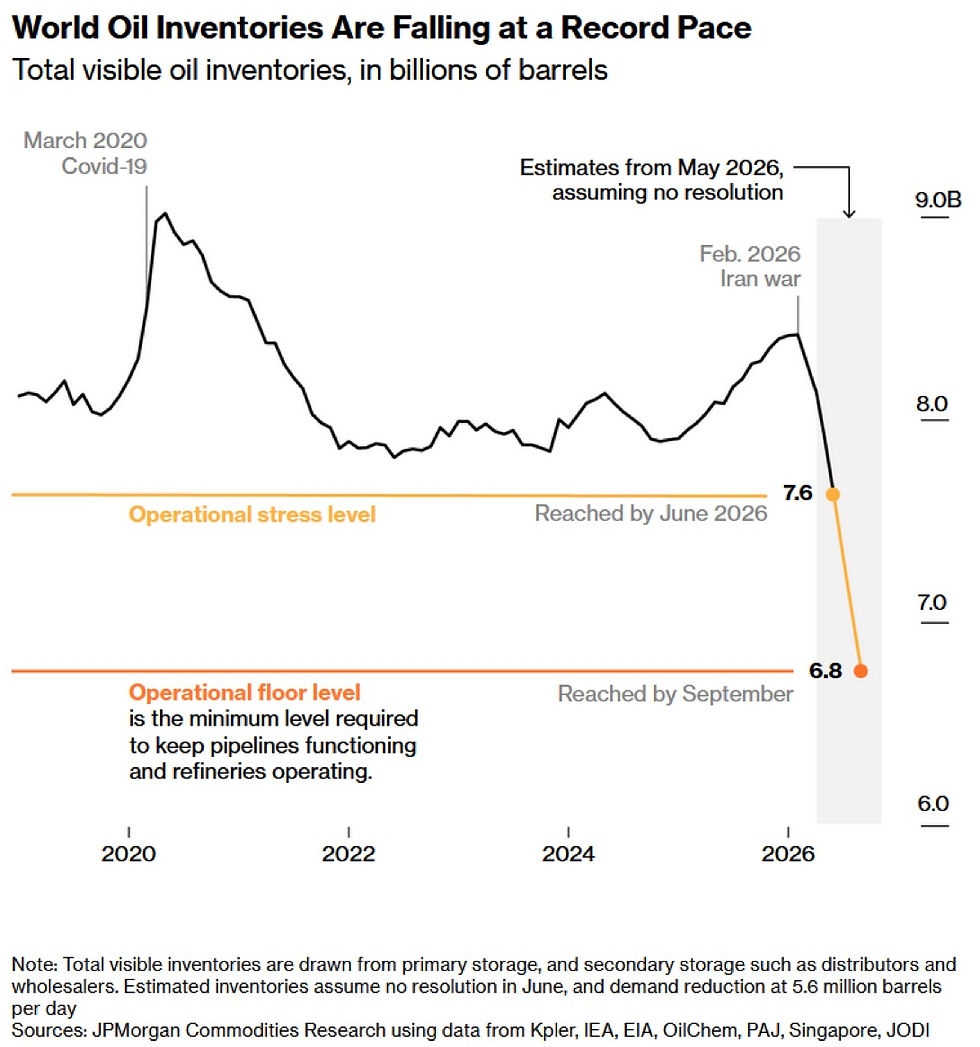
The macro contradiction is now the central trading risk. Oil sold off on ceasefire headlines, but visible oil and product inventories are still drawing. One inventory chart now places U.S. total petroleum inventories including SPR near the zone where the real WTI curve historically steepens. Another shows world visible oil inventories falling toward an operational stress level around 7.6 billion barrels, with a possible draw toward 6.8 billion barrels if the conflict persists and demand destruction reaches 5.6 million barrels per day. Singapore residual fuel oil inventories fell 6.5% to 19.35 million barrels, the lowest weekly level in more than a year, and Middle East supply into Singapore tanks was zero for the week to June 3. India demand also remains relevant, with BPCL reporting gasoline sales up 4.29% year on year and diesel sales up 6.72% year on year. That is important because the market is pricing a peace scenario while the physical oil system is still priced around rerouting, low stocks, and expensive replacement barrels.
For biodiesel and renewable diesel traders, today’s message is simple. The energy screen gave back war premium, but the RFS complex did not. D4 RINs near $2.43, BOGO above $626/mt, BOPO near $503/mt, conventional biodiesel crush near $1/gal, screen heat crack still above $61/bbl, and ARA UCOME around $1,588/mt flat all point to a market where policy value is still overpowering the crude correction. The first real bearish signal would be imported feedstock or imported renewable fuel arriving at enough scale to pressure D4 RINs and pull U.S. soybean oil back toward world values. Until that happens, dips in energy reduce flat price but do not solve the underlying biodiesel squeeze.


Comments